Wednesday, October 26, 2022

PSL ranks No. 6 city in Florida with the most new businesses


22 FL Cities With The Most New Businesses: Study


Florida and other Southern states rank high for new businesses, a study said. 22 FL cities are on a list of most new businesses per capita.


FLORIDA — As worries about the U.S. tipping into a recession continue, one study says a reason for optimism is an elevated level of new business creation since the start of COVID-19.


The U.S. has averaged more than 400,000 monthly applications for new businesses since the pandemic began, buoyed by government stimulus payments, low interest rates and increased home values during the pandemic, along with the Great Resignation as workers decided to strike out on their own, according to the analysis by Smartest Dollar.


Florida and other parts of the South rank high for entrepreneurs starting their own businesses, the study said. From the Miami metro leading the largest category of cities, to The Villages at the bottom of the small cities list, the state has 22 cities among the tops for new businesses, Smartest Dollar’s report said.


Among metro areas, Florida’s cities stand out as the nation’s leaders in new business formation. With a fast-growing population, low taxes, and other business-friendly attributes, the Sunshine State is home to four of the top six major cities for new businesses per capita, according to data from the U.S. Census Bureau.


Here are the Florida metropolitan areas with the most new businesses, broken down by large, midsize and small metros.


Large Metros


No. 1 Miami-Fort Lauderdale-Pompano Beach


  • New business applications per 1k residents: 44.14

  • Total new business applications (2021): 270,966


No. 3 Orlando-Kissimmee-Sanford


  • New business applications per 1k residents: 30.76

  • Total new business applications (2021): 82,239


No. 5 Tampa-St. Petersburg-Clearwater


  • New business applications per 1k residents: 25.22

  • Total new business applications (2021): 80,089


No. 6 Jacksonville


  • New business applications per 1k residents: 25.18

  • Total new business applications (2021): 40,436


Midsize Metros


  • No. 2 Naples-Marco Island, 9,536 new business applications

  • No. 6 Port St. Lucie, 11,670

  • No. 9 Tallahassee, 9,054

  • No. 10 Cape Coral-Fort Myers, 17,719

  • No. 12 Lakeland-Winter Haven, 16,066

  • No. 14 North Port-Sarasota-Bradenton, 17,273

  • No. 19 Deltona-Daytona Beach-Ormond Beach, 12,758

  • No. 21 Ocala, 7,045

  • No. 26 Palm Bay-Melbourne-Titusville, 10,655

  • No. 28 Pensacola-Ferry Pass-Brent, 8,662


Small Metros


  • No. 10 Panama City, 4,197

  • No. 13 Crestview-Fort Walton Beach-Destin, 6,605

  • No. 26 Sebastian-Vero Beach, 2,878

  • No. 34 Gainesville, 5,666

  • No. 38 Sebring-Avon Park, 1,592

  • No. 40 Punta Gorda, 2,837

  • No. 72 Homosassa Springs, 1,912

  • No. 123 The Villages, 1,283


Wyoming leads the U.S. with 58.12 new business applications per 1,000 residents — potentially a product of the state’s low population, but also its lack of income taxes — while Delaware, a famously business-friendly state, comes in second at 44.98.


Other more active states for new business tend to be found in the South, while New England and the Midwest have lower levels of new business applications.


To determine the locations with the most new businesses per capita, researchers at Smartest Dollar — a website that compares small business insurance and products — calculated the number of new business applications per 1,000 residents for the year 2021.


Read the full report at https://smartestdollar.com/research/cities-with-the-most-new-businesses-per-capita.


Methodology & Detailed Findings


The data used in this study is from the U.S. Census Bureau’s Business Formation Statistics dataset. To determine the locations with the most new businesses per capita researchers at Smartest Dollar calculated the number of new business applications per 1,000 residents for the year 2021. In the event of a tie, the location with the greater total number of business applications in 2021 was ranked higher. Researchers also provided statistics on the one-year (2020–2021) and two-year (2019–2021) change in new business applications. To improve relevance, only locations with at least 100,000 residents were included. Metropolitan areas were further grouped based on population size: small (100,000–349,999), midsize (350,000–999,999), and large (1,000,000+)


Rising debt may ‘adversely affect’ older adults’ health


Debt has risen among older adults which could correlate with multiple illness diagnoses, but secured debt was less detrimental than unsecured debt according to data


Older adults who find themselves burdened by debt in later life are faring worse on a variety of health-related issues when directly compared to their less-indebted counterparts. This is according to research from the Urban Institute, highlighted recently in a story published by the New York Times.


“[R]esearchers at the Urban Institute, by analyzing broad national data over nearly 20 years, have reported that indebted older adults fare measurably worse on a range of health measures: fair or poor self-rated health, depression, inability to work, impaired ability to handle everyday activities like bathing and dressing,” the story reads.


Those who reported themselves as in debt were also more likely to have ever had at least two or more illnesses diagnosed by a physician, including heart and lung disease, cancer, heart attacks, strokes, diabetes and hypertension, the story reads based on the data.


However, drawing a direct link between the accumulation of debt and a higher degree of health risks is not necessarily the aim of the research according to Stipica Mudrazija, a senior research associate with the Urban Institute.


“Debt is not a bad thing in and of itself,” he told the Times. “If it’s used cautiously, it can build up wealth over time.”


In eras past, it was more typical for seniors to reduce their levels of debt the closer they became to retirement. In more recent times, however, succeeding generations of seniors have increased their debt levels as opposed to their predecessors, the story reads.


“There’s a group of older people in financial distress,” said Annamaria Lusardi, an economist at the George Washington University to the Times. “They’re highly leveraged; they’re carrying high-cost debt. They’re being contacted by debt collectors. They’re not going to enjoy their golden years.”


Based on data from the nationwide Health and Retirement Study (HRS), 43% of older Americans at or over the age of 55 carried debt at a median level of just over $40,000. By 2016, the percentage of affected older adults had risen to 57%, with the median level rising to just under $63,000.


The kind of debt, however, factored into the data. Secured debt — including from a mortgage or derived from some other kind of home loan — appeared less detrimental to health than unsecured debt — such as credit card debt, student loans or medical balances — according to the study published by the Boston College Center for Retirement Research (CRR).


Tuesday, October 25, 2022

Where Are Young People Buying Homes?


The housing market has increasingly discouraged young people from buying homes. A June 2022 survey by Money and Morning Consult found that given the state of the housing market over the past two years, 48% of Generation Z and 44% of Millennials report that they are less likely to buy a home. This is significantly higher than the 38% of people overall who report wariness.


Some cities, however, have attracted more young homebuyers in recent years than others. In this study, SmartAsset analyzed the cities where more (and fewer) young people are buying homes. We compared 200 of the largest cities across two metrics: 2021 homeownership rate for those under 35 and the 10-year change in homeownership rate for those under 35. For more information on our data and how we put it together, read our Data and Methodology section below.


This is SmartAsset’s second annual study on where young people are buying homes. Read last year’s version here.


Key Findings


  • In eight cities, more than half of young people own their homes. The under-35 homeownership rate is highest in Florida’s Port St. Lucie (roughly 60%). In comparison, nationally, only about 37% of individuals under the age of 35 own their home or apartment.

  • California cities rank at the top and bottom of our list. Two California cities rank in our top 10 places where more young people are buying homes (Ontario and Roseville), while four rank in our bottom 10 (Fullerton, Glendale, Torrance and Salinas). Interestingly, though Ontario and Fullerton are less than 30 miles away from each other, the under-35 homeownership rate varies by more than 27 percentage points (41.25% in Ontario and only 13.32% in Fullerton).

  • Across the 10 largest cities, Philadelphia ranks highest. Ranking in the top half of the study, about 27% of young people in the City of Brotherly Love are homeowners. In stark contrast, this figure is less than 13% in the two largest U.S. cities (New York and Los Angeles).


Where More Young People Are Buying Homes


Surprise, Arizona ranks as the top place where more young residents are buying homes. Surprise has seen a 10-year increase of 15.88 percentage points in the homeownership rate among people younger than 35, the second-largest growth in our study. The total homeownership for that age cohort in 2021 was 57.60%, also the second-highest rate we analyzed for that metric.


Across the other top nine cities where more young people are buying homes, Chesapeake, Virginia had the best overall 10-year change in the homeownership rate for those under 35. Census Bureau data shows that from 2011 to 2021 the under-35 homeownership rate in Chesapeake grew by almost 16 percentage points. Meanwhile, the 2021 homeownership rate for young people is highest in Port St. Lucie, Florida (60.23%).


Where Fewer Young People Are Buying Homes


Two of the three places where the fewest young people are buying homes are in New Jersey. These Garden State cities are Paterson and Jersey City. In both cities, less than 12% of people under 35 are homeowners and the under-35 homeownership rate is declining. In Paterson, the under-35 homeownership rate dropped by more than nine percentage points between 2011 and 2021.


As previously noted, four cities in California rank at the bottom of our list. Across those cities, the under-35 homeownership rate is lowest in Glendale (9.90%) and declining the most in Fullerton (-8.73%). The table below shows the top 10 cities where fewer young people are buying homes.


Data and Methodology


To find the cities where more and fewer young people are buying homes, SmartAsset examined data for 200 of the largest cities in the U.S. We considered two metrics:


  • 2021 homeownership rate for those under 35. This is the homeownership rate among 18- to 34-year-olds. Data comes from the U.S. Census Bureau’s 2021 1-year American Community Survey.

  • 10-year change in homeownership rate for those under 35. This compares the homeownership rate among 18- to 34-year-olds in 2011 and 2021. Data comes from the U.S. Census Bureau’s 2011 and 2021 1-year American Community Surveys.


First, we ranked each city in both metrics. Then we found each city’s average ranking and used the average to determine a final score.


Saving Tips for Millennials


  • Invest early. At the onset of your career, it’s important to dedicate some of your earnings to building up savings for retirement. By planning and saving early you can take advantage of compound interest. Take a look at our investment calculator to see how your investment can grow over time.

  • Buy or rent? When you’re moving to a new city, you need to decide if you are going to rent or buy. If you are coming to a city and plan to stay for the long haul, buying may be the better option for you. On the other hand, if your stop in a new city will be a short one, you’ll likely want to rent.

  • Consider a financial advisor. An expert can help you maximize your money with guidance on savings, investments and retirement. SmartAsset’s free tool matches you with up to three financial advisors who serve your area, and you can interview your advisor matches at no cost to decide which one is right for you. If you’re ready to find an advisor who can help you achieve your financial goals, get started now.


STEPHANIE HORAN, CEPF®Stephanie Horan is a data journalist at SmartAsset. A Certified Educator of Personal Finance (CEPF®), she sources and analyzes data to write studies relating to a variety of topics including mortgage, retirement and budgeting. Before coming to SmartAsset, she worked as an analyst at an asset management firm. Stephanie graduated from Williams College with a degree in Mathematics. Originally from Philadelphia, she has always been a Yankees fan and currently lives in New York.


Reverse mortgages have gotten ‘a makeover’


Reverse mortgages have often been described by both industry insiders and outside observers as having a reputational problem with the general public. However, as more product reforms have proliferated on the side of the Federal Housing Administration (FHA)-sponsored Home Equity Conversion Mortgage (HECM) program and as lenders have developed their own private-label reverse mortgage products, the tide may be beginning to turn.


This is according to a new feature published in the Wall Street Journal, which interviews financial advisors and reverse mortgage industry experts to paint a broader picture of how the reverse mortgage product and industry have changed over the course of the past decade.


Wade Pfau is a financial professional who has openly discussed the utility of a reverse mortgage for senior clients.


“For decades the industry’s image was tainted by horror stories about borrowers who faced foreclosure, and surviving spouses who were evicted,” the article begins. “But today, these products — first introduced in 1961 — have evolved into tools that, with federal insurance and oversight, often do what was originally intended: ease financial burdens for retired homeowners with limited incomes who want to stay in their homes until death.”


This is evident in the number of borrower protections that reverse mortgages have as product features, including limits on loan amounts; the non-recourse feature in case the home being borrowed against accrues a higher loan balance than the value of the property; and a raft of new protections implemented to protect non-borrowing spouses (NBS) from being displaced should the primary borrower pass away or move out of the home.


“Reverse mortgages still represent just a small part of the financing options that senior homeowners choose to meet their needs in later life,” the article reads. “And there are still some downsides to HECMs, such as high upfront fees. The burden of paying off the loan, meanwhile, falls on your heirs, though they have the option of keeping the house if they do pay off the loan.”


The article enlists input from financial planners including Wade Pfau, well-known in reverse mortgage circles and who recently released an updated edition of his book on the topic which he previously spoke to RMD about.


The article also discusses the specifics of the product with Steve Irwin, president of the National Reverse Mortgage Lenders Association (NRMLA) and academic researcher John Salter, who has helped create highly influential literature on the topic of reverse mortgages.


The article also offers caveats that are similarly discussed openly by reverse mortgage professionals.


“It is wise to have a financial adviser guide you through the process of deciding whether an HECM is right for you, and choosing the best payment option if so,” it reads. “If you miscalculate on the payouts, you could outlive the proceeds.”


Monday, October 24, 2022

Existing-home sales continue to slide amid housing correction


Existing-home sales fell to another record low in September as the housing market continues to undergo an adjustment due to the continuous surge in interest rates, the National Association of REALTORS said Thursday.


Total existing-home sales in September declined for the eighth consecutive month, down 1.5% from August to a seasonally adjusted annual rate of 4.71 million – the slowest pace since September 2012. Sales were also lower by 23.8% compared to a year ago.


NAR chief economist Lawrence Yun said that higher mortgage rates, which eclipsed 6% for 30-year fixed mortgages in September and are now approaching 7%, have caused the slowdown in sales.


Despite weaker sales, Yun noted that some homes are still receiving multiple offers and selling above the list price due to limited supply. Total housing inventory decreased 2.3% month over month and 0.8% year over year to 1.25 million units in September. At the current sales rate, unsold inventory represents a 3.2-month supply – unchanged from August and up from 2.4 months in September 2021.


“The current lack of supply underscores the vast contrast with the previous major market downturn from 2008 to 2010 when inventory levels were four times higher than they are today,” Yun said.


Properties typically remained on the market for 19 days in September, three days longer than in the previous month. Around 70% of homes sold were on the market for less than a month.


The median existing-home price for all housing types was $384,800, an 8.4% increase from last year’s $335,100. While price appreciation continued in September, its pace decelerated for the third month in a row after hitting a record high of $413,800 in June.


“In addition to the greater affordability constraints for potential homebuyers, many existing homeowners likely feel ‘locked-in’ to their existing, lower-interest-rate mortgages,” said Doug Duncan, Fannie Mae’s chief economist. “This contributes to fewer homes being listed, as well as fewer potential buyers, and may lead to a growing share of listings having to cut prices to meet the reduced demand.


“Furthermore, the supply of completed, new single-family homes for sale has started to rise, suggesting that homebuilders may also need to begin offering greater price concessions to move inventory. We expect these trends to continue in the coming months.”


Reverse mortgages are hot, hot, hot


Rising rates may begin to be having their first effects on the activity of the reverse mortgage industry, based on the latest industry performance metrics for the prior month and according to leading industry analysts.


Home Equity Conversion Mortgage (HECM) endorsements fell in May 2022 by 7.7% to 5,783 loans, the second consecutive monthly volume reduction even though the figure remains high by recent historical standards. This is according to data compiled by Reverse Market Insight (RMI). While both March and April featured historic production of over 6,000 loans — a threshold that would’ve seemed highly unlikely just a couple of years ago — higher rates appear to have driven industry activity below that threshold.


The production of new HECM-backed securities (HMBS) in May reached $1.45 billion, a drop from the over $1.6 billion in HMBS issuance seen the prior month. May marked the 15th month after the London Interbank Offered Rate (LIBOR) “era.” As previously stated, a total of $13.2 billion in HMBS issued in 2021 easily overtook the previous industry record of $10.8 billion set in 2010, according to publicly available Ginnie Mae data and private sources compiled by New View Advisors.


Endorsements are down, but activity remains high


While a rise in 10-year Constant Maturity Treasury (CMT) rates may have impacted the reduction in volume somewhat, interestingly the number of HECM case numbers issued by the Federal Housing Administration (FHA) showed approximately a 10% increase, according to RMI.


When asked about what the industry should take away from this latest glimpse at industry activity, RMI Director of Client Relations Jon McCue adds more relevant historical context to these figures.


“Well, I don’t think we need to sound any alarms as an industry quite yet given this month still saw our third-highest volume total in the past 12 months, and the best May since 2009,” he says. “However, the endorsement volume is trending downward as the 10-year CMT trends up, and that is most likely because H2H is trending downward. We’ll know by how much exactly in a few weeks though.”


This could be a quickly-emerging sign of the dissipation of the so-called “refi boom,” where HECM-to-HECM refinances have been driving at or nearly half of industry activity for most of the past year, but it may also be a little too soon to make a full determination on that matter, McCue says.


“Until we get the actual refi numbers this may be a bit premature to answer definitively, but as with any ‘refi boom,’ they always end,” McCue says. “The good news for our industry, though, is that our lending environment is still much more favorable than it is in the forward space. Our clients already have homes, they have equity, and they can always use more cash especially given the current state of the economy.”


Even as rates rise, reverse mortgage product penetration remains at only 2.2% among the 27 million age-eligible households that could qualify for a HECM, McCue adds.


“That isn’t even counting the additional number that can qualify for any of these 55-plus [proprietary] products,” he says. “So, even with rates rising we still have a lot households that will qualify for these loans. That means that growing new business shouldn’t be too hard since most of our age-eligible population doesn’t have this product yet.”


In spite of changing dynamics, the fundamentals of the reverse mortgage industry remain strong based on what can currently be gleaned, McCue says. Echoing some of the conversation on a recent episode of the HousingWire Daily podcast, RMI is also hearing of additional interest among industry participants in proprietary products.


“We have heard similar things around the industry,” McCue says. “Unfortunately, the data around those products are cloudy at best. We could see HECM drop, but some of that volume may be getting picked up under these other offerings. Until we see a huge drop in either case numbers or actual endorsements for HECM, the best thing we can recommend is to make sure you’re going after new clients.”


HMBS issuance down, but on track for record 2022


When asked about what first comes to mind regarding the HMBS issuance data for May, New View Partner Michael McCully still sees a lot of positive signs in the way things are moving, he explains.


“While PLFs are down, and the refi opportunity diminished, HPA is up materially, and proceeds remain generous for first-time borrowers looking to unlock equity in their homes,” McCully says. “From a proceeds perspective, the combined impact of HPA and increased lending limits may largely offset rising rates.”


New View’s HMBS issuance commentary notes that the industry is still on track to break a record once again at the end of the year. In spite of a general reduction in issuance this month, the general trajectory of issuance remains strong, he explains.


“As we noted, the industry remains on track for another record year in 2022,” he says. “However, the third quarter will be a better indicator for year-end trajectory.”


In terms of comparison, performance this year industry-wide will be challenged when looking directly at 2020 and 2021, McCully says. That challenge strikes the forward and reverse mortgage businesses indiscriminately.


“Rising rates will put downward pressure on earnings, forward and reverse,” he explains. “It will be very difficult to replicate the perfect lending conditions that existed during the second half of 2020 and 2021, even with the pandemic.”


Friday, October 21, 2022

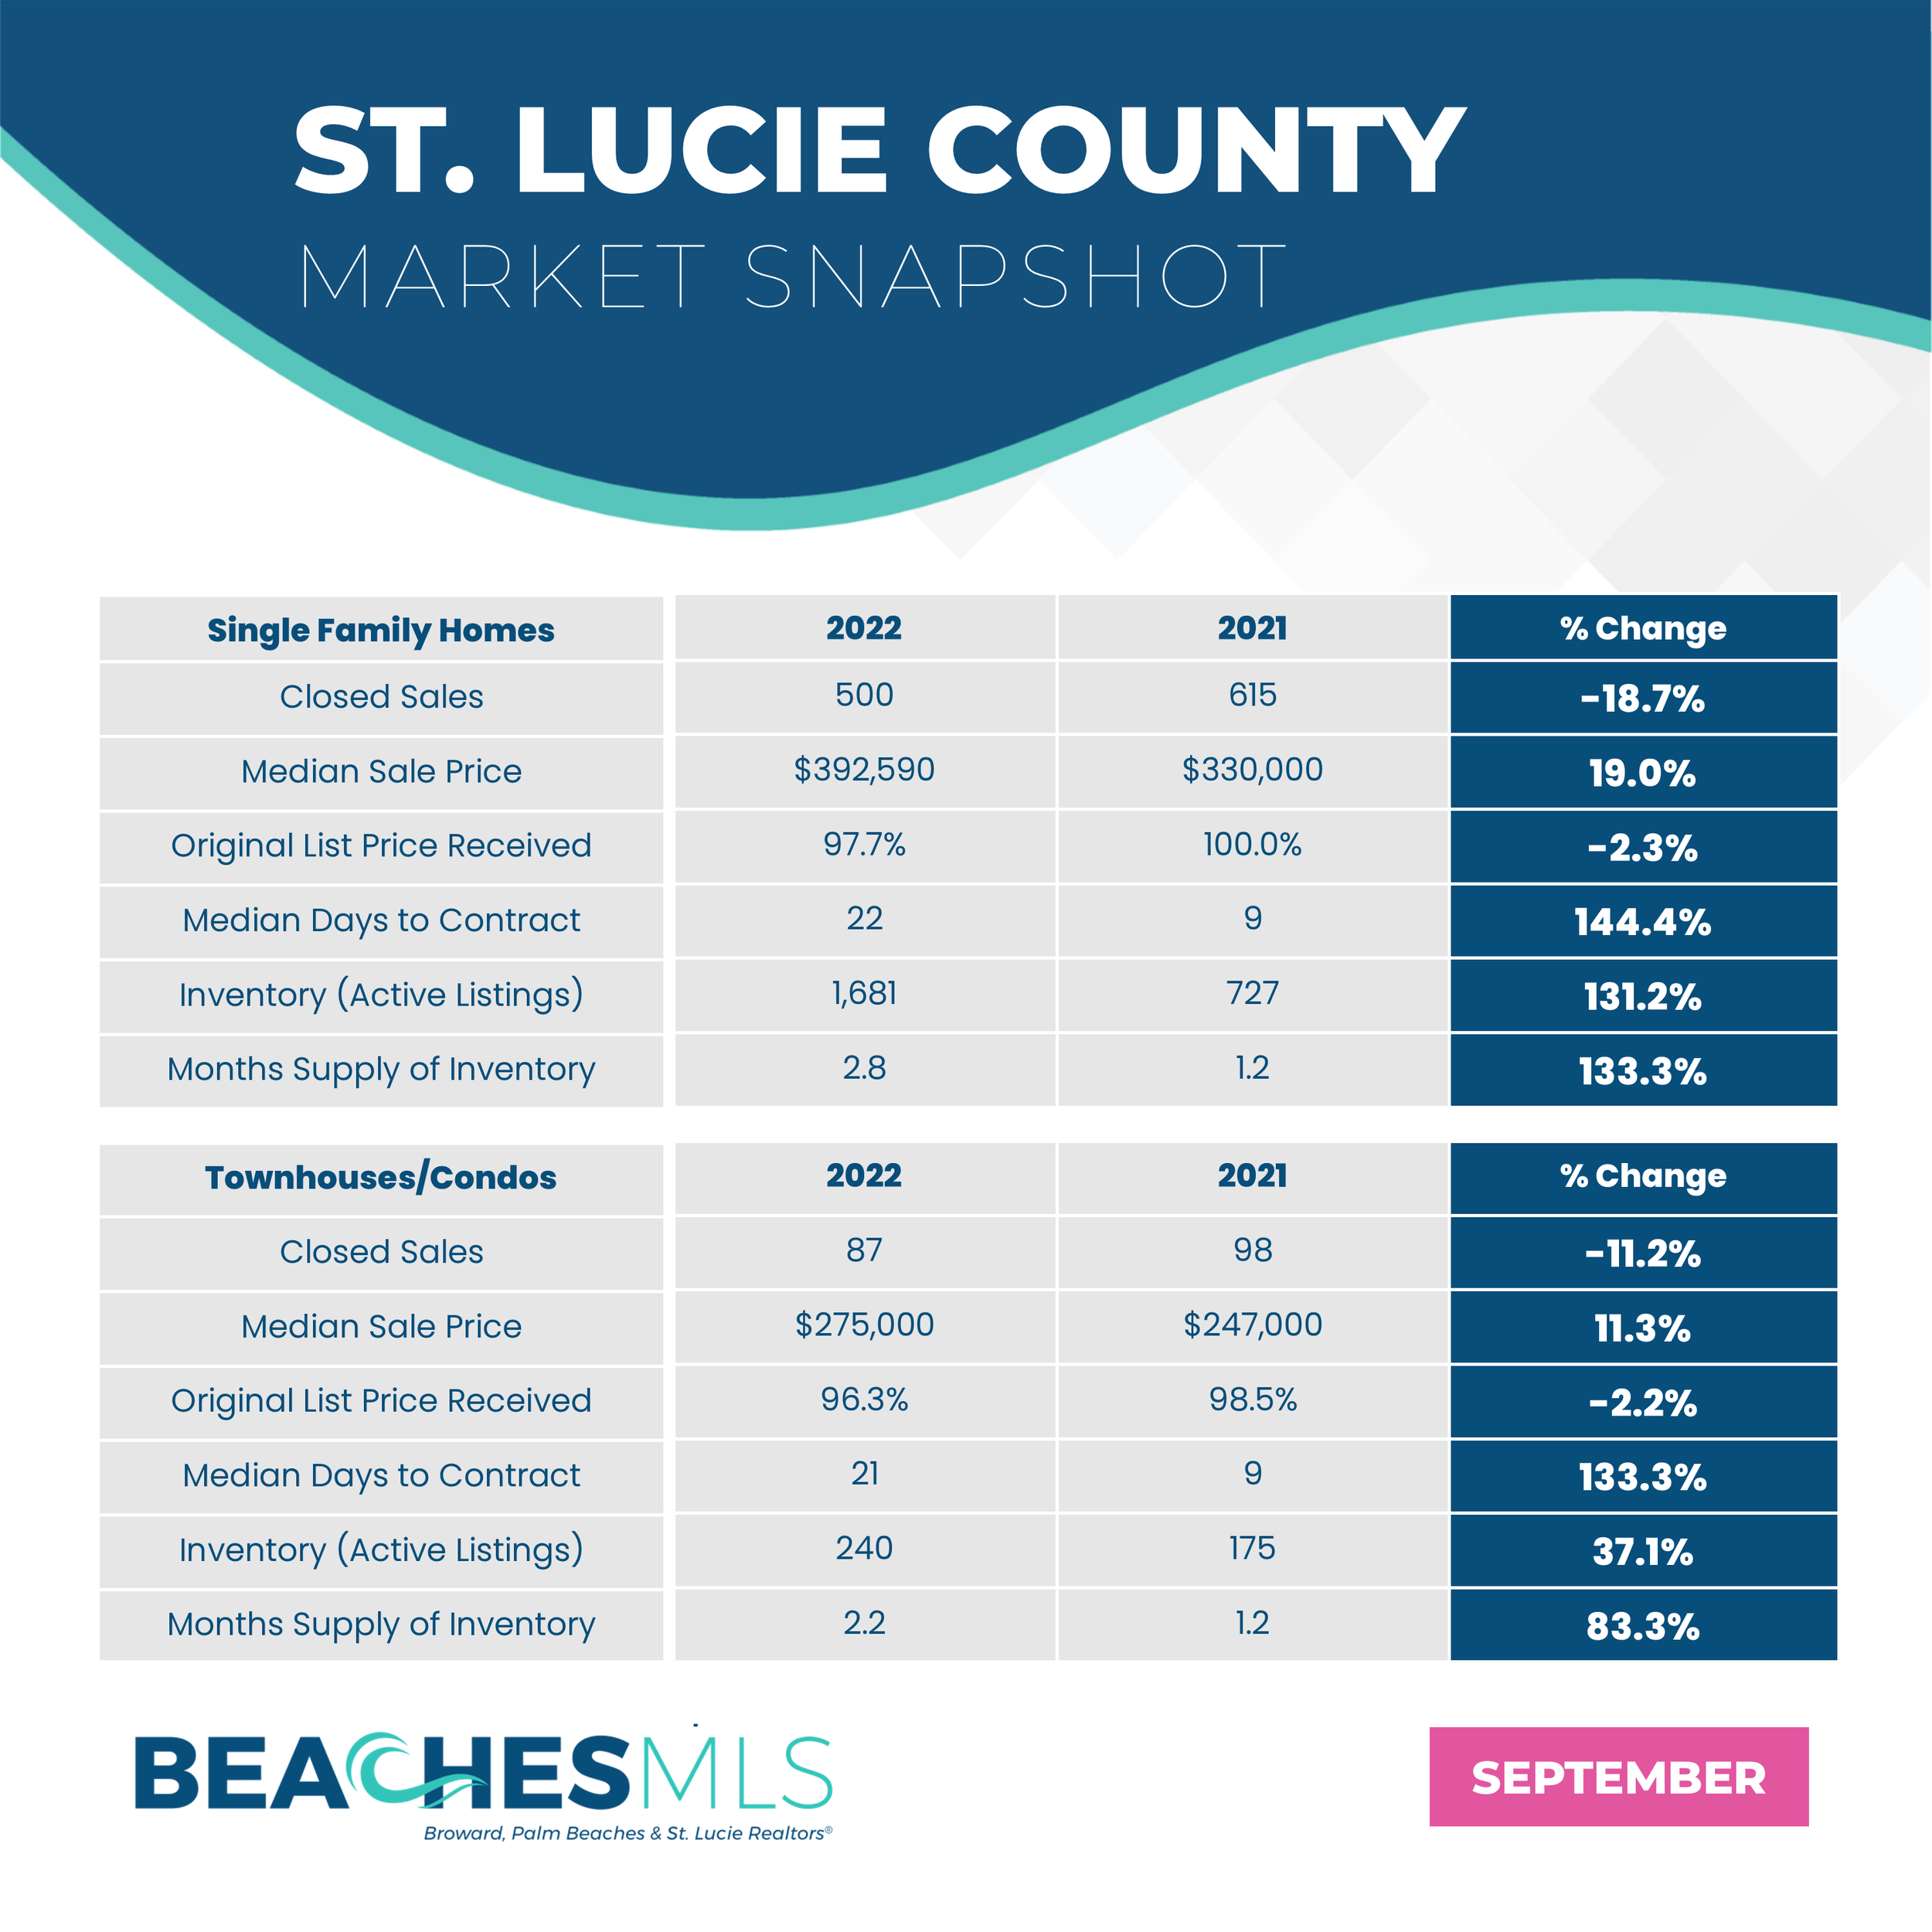
ST. LUCIE HOUSING INVENTORY RISES, SUPPLY REACHES 2.8 MONTHS


Just in! September 2022 reports have been released from Florida Realtors® detailing recent real estate activity in St. Lucie County. The reports compare year-over-year data. Here are statistics on single-family homes.


The upward trend continued in September, with the year-over-year monthly supply of inventory reaching 2.8 months. The median home price also rose again, with an increase of 19 percent to $392,590.


“With inventory rising, Realtors® and their buyers have the opportunity to comb through more listings to find that perfect home that’s just right. Even with more competing listings, sellers are still receiving a median of 97.7 percent of their original listing price,” said Carlos A. Melendez, President of Broward, Palm Beaches & St. Lucie Realtors®.


The Broward Palm Beaches & St. Lucie Realtors® also reports that closed sales are down 18.7 percent in September. Contact a local Realtor® today — they are the market experts and will serve as your advocate in the home buying or selling process. Learn more on how Realtors® can serve your needs at OnlyARealtor.com.


View Reports: Single Family | Townhomes/Condos


Broward, Palm Beaches & St. Lucie Realtors® is the 3rd largest local Realtor® association in the nation, representing over 42,000 Realtors®. Their subsidiary, BeachesMLS, powers over 43,000 MLS subscribers across South Florida & the Treasure Coast. For more info, visit Rworld.com or contact Communications@rworld.com.